This article summarizes the key financial results for medical professional liability (MPL) specialty writers from the first quarter of 2026, marking the start of the 17th consecutive year of tracking and publishing these results in Medical Liability Monitor. As in prior years, we compare historical first-quarter financial results with full-year figures to provide insight into where 2026 annual results may be headed. The analysis reflects the collective financial performance of a large group of insurers specializing in MPL coverage. It draws upon 20 years of aggregate statutory financial data compiled by S&P Global Market Intelligence. The current composite includes 194 MPL specialty companies that reported more than $8.7 billion in direct premium written in 2025.
Premium reaches new highs
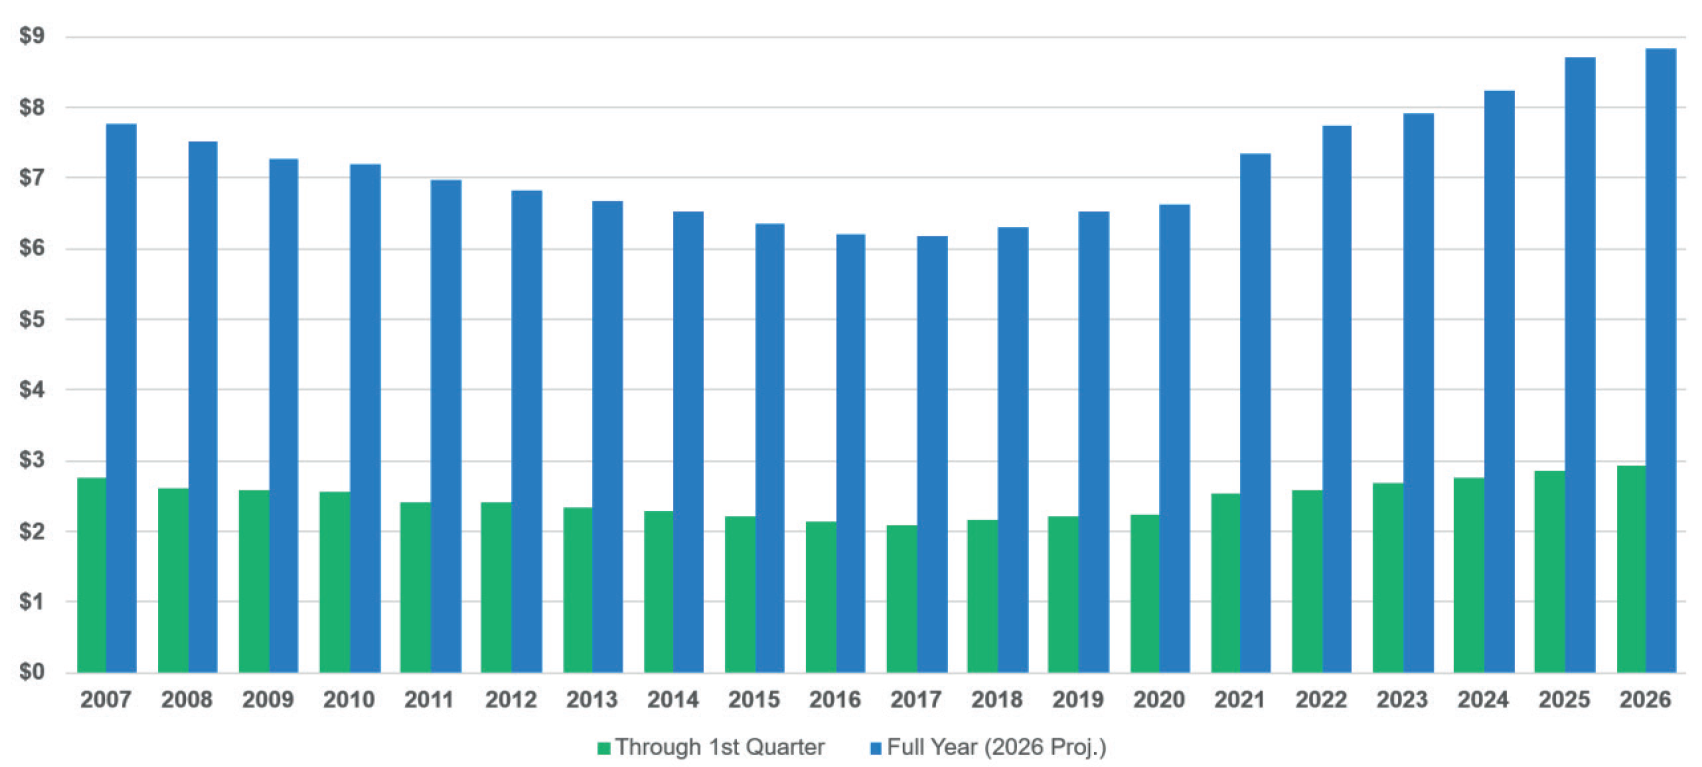
Since reaching a low point in the first quarter of 2017, our composite’s direct written premium has continued on a steady upward trajectory. That trend remained in the first quarter of 2026, with premium growth pushing results to the highest first-quarter level observed in the past 20 years. As illustrated in Figure 1, direct written premium totaled $2.92 billion in Q1 2026, representing an increase of approximately 2% compared with the same period in 2025 and reflects a cumulative rise of nearly 40% since 2017.
The full-year outlook for 2026 suggests the upward trend will continue. As shown in Figure 1, direct written premium is projected to exceed $8.8 billion, which would represent the highest annual total recorded in the past 20 years.
Figure 1: Direct written premium — Q1 vs. full year ($billions)
Reserve development outlook remains unclear
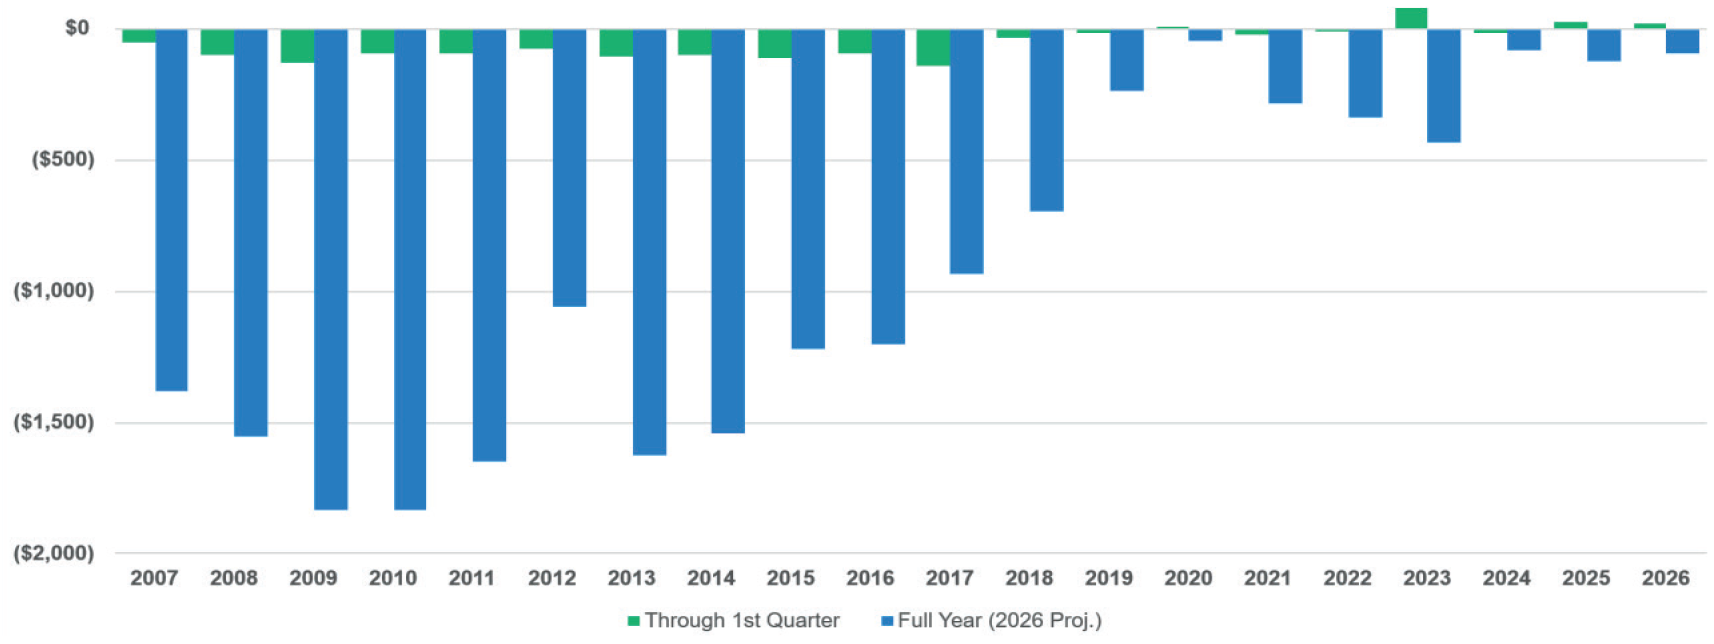
The first quarter of 2026 continued the recent pattern of modest adverse one-year reserve development associated with prior accident years. As shown in Figure 2 (below), our composite reported an $18 million increase in reserve development during the first quarter of 2026. This result is broadly consistent with recent experience, as our composite averaged approximately $11 million in first-quarter reserve development annually between 2020 and 2025.
Although the first quarter has reflected modest adverse reserve development in several recent years, those early-year results have not been predictive of full-year performance. Our composite has reported favorable annual reserve development in each of the past seven years. Looking ahead, we expect full-year 2026 one-year reserve development to remain favorable, consistent with the broader trend of recent years. However, the ultimate magnitude of that favorable development remains uncertain at this time.
Figure 2: Cumulative reserve development — q1 vs. full year ($millions)
Combined ratios hold steady
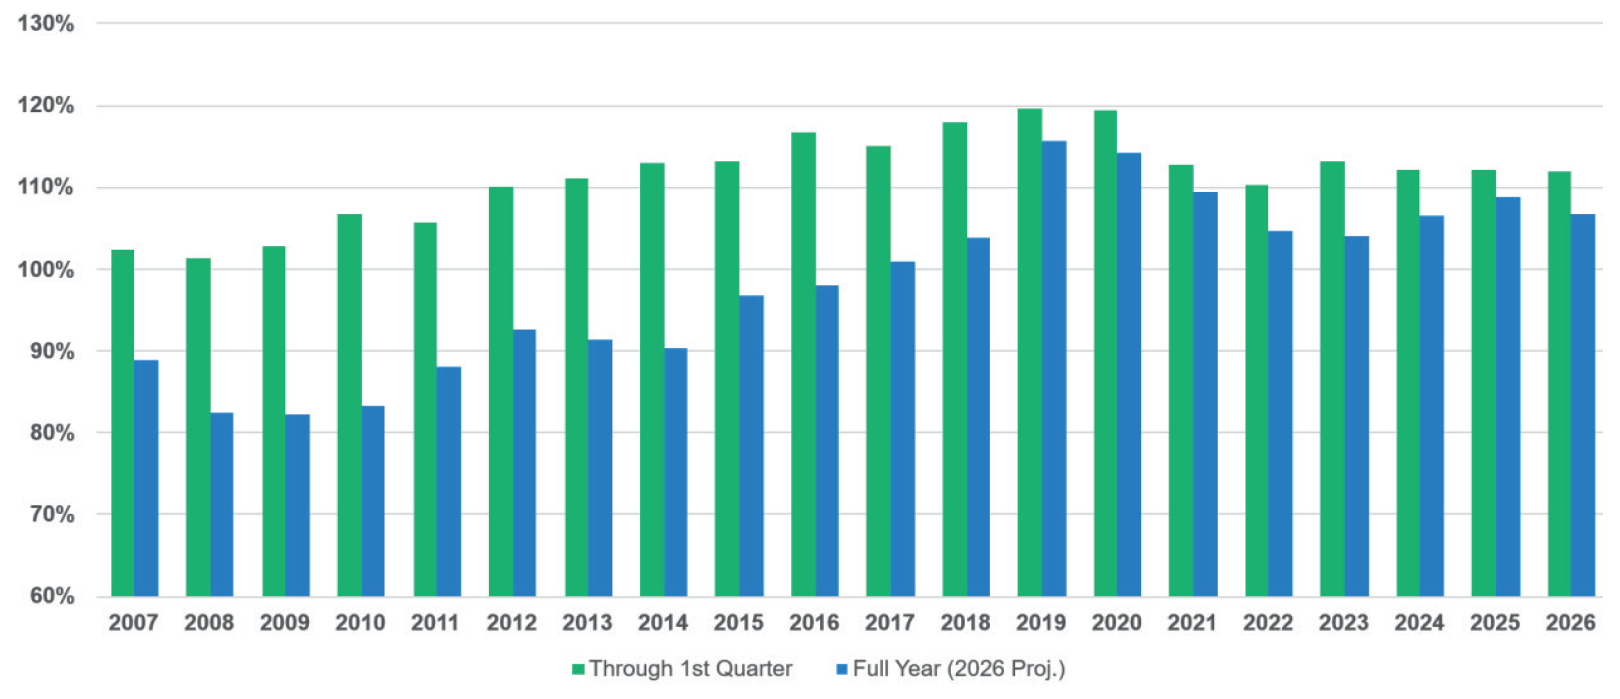
Our composite’s combined ratio for the first quarter of 2026 was 112%, nearly unchanged from the first quarters of 2024 and 2023 (see Figure 3 on page 7). This suggests that overall underwriting performance remained stable year over year, even though the underlying components of the combined ratio shifted somewhat.
Specifically, two components of the combined ratio increased: the loss adjustment expense (LAE) ratio and the policyholder dividend ratio. The higher LAE ratio indicates that the cost of investigating, managing and resolving claims increased during the quarter. Meanwhile, the higher dividend ratio reflects that a larger share of earned premiums was returned to policyholders in the form of dividends.
Those increases were offset by improvements in two other components of the combined ratio. The loss ratio declined, indicating that insured losses accounted for a smaller share of earned premium than in the prior-year period. The fixed expense ratio also decreased, suggesting improved operating efficiency or a lower relative burden of overhead costs.
Figure 3: Combined ratio (after PH dividends) — Q1 vs. full year
Investment income eases slightly
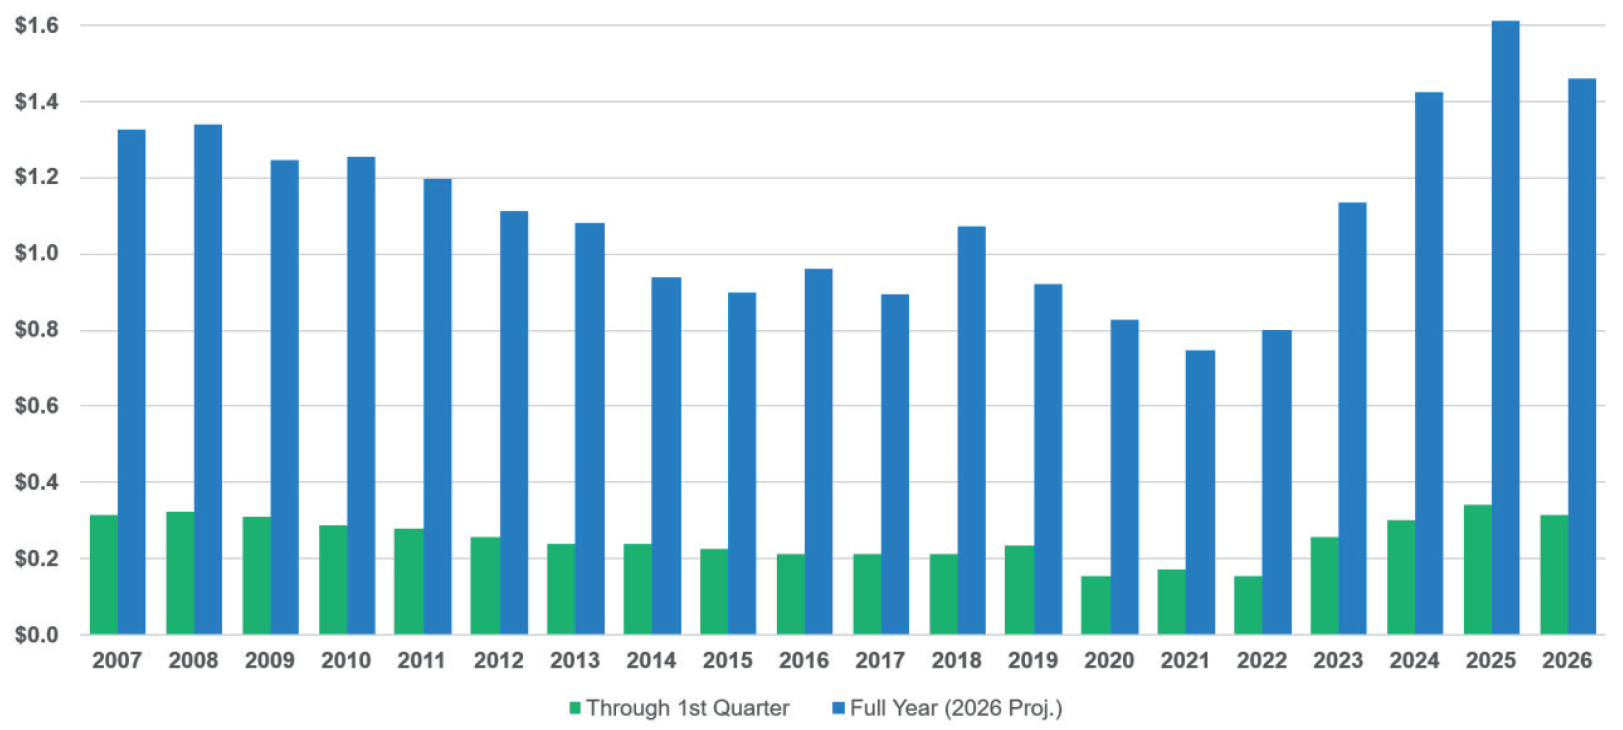
Our composite reported investment income of $315 million in the first quarter of 2026, a modest decline from the first quarter of 2025, as shown in Figure 4 (at right). Even so, the result is in line with the prior three year first-quarter average of approximately $300 million and ranks as the fourth-highest first-quarter investment income recorded during the 20-year lookback.
Looking ahead, full-year 2026 investment income is projected to exceed $1.4 billion. While that would represent a strong annual result by historical standards, it is expected to fall short of the record investment income reported in 2025.
Figure 4: Investment income — Q1 vs. full year ($billions)
Surplus mantains strength
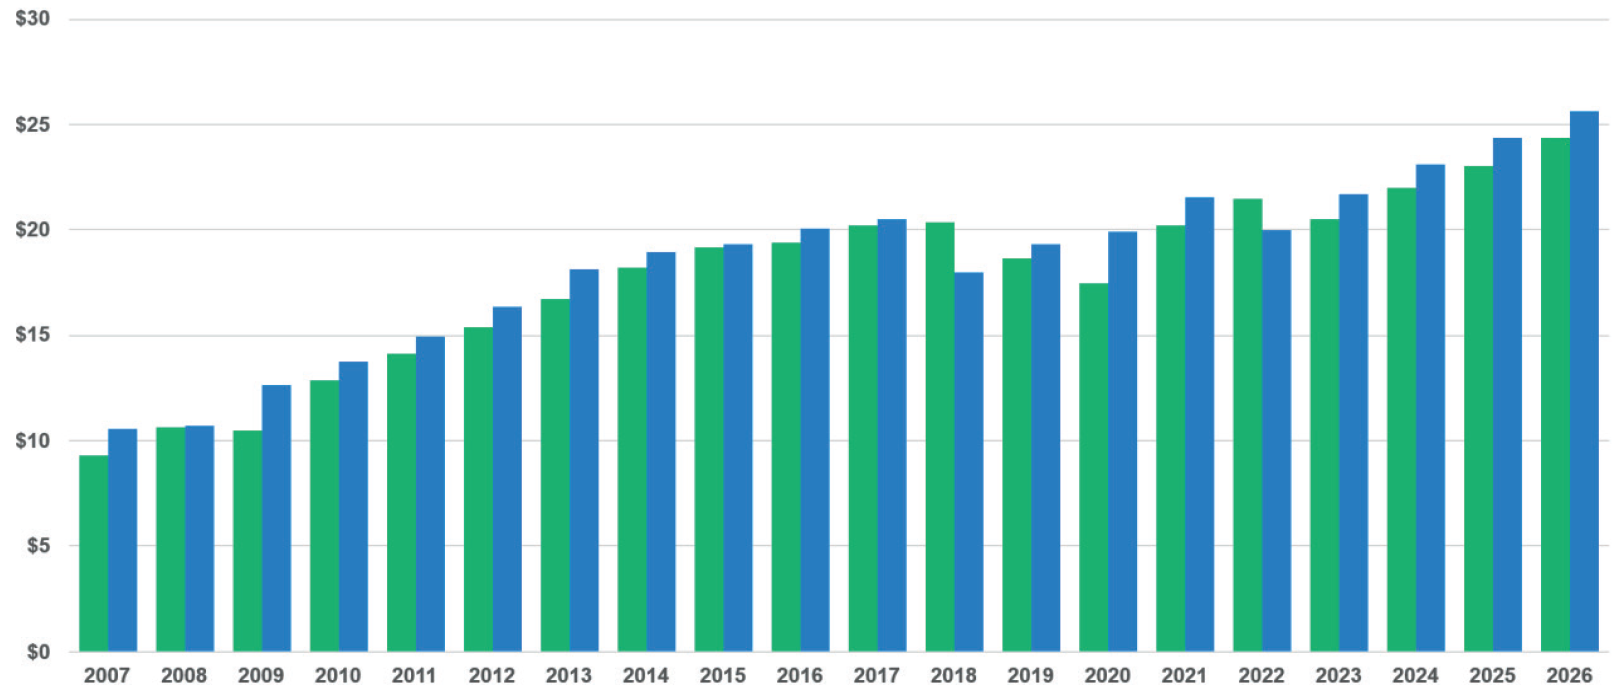
As shown in Figure 5, our composite’s policyholder surplus reached $24.4 billion in the first quarter of 2026. That represents a year-over-year increase of nearly 6% from the first quarter of 2025 and is more than 2.5 times the $9.3 billion reported in the first quarter of 2007, the earliest period included in our 20-year analysis.
This sustained growth highlights the extent to which our composite has expanded and strengthened its balance sheet over time. It also demonstrates that, despite cyclical pressures in underwriting results and broader market volatility, our composite has been able to build capital consistently over the long term.
Figure 5: Policyholder surplus - Q1 vs full year ($billions)
Conclusion
Our composite entered 2026 in a position of continued financial strength. Direct written premium continued its steady growth, reaching a record first-quarter level, while policyholder surplus increased further, reinforcing the composite’s strong capital position. Although first-quarter reserve development was modestly adverse and the combined ratio remained elevated, full-year results are expected to improve as favorable reserve development emerges later in the year. Meanwhile, investment income remains strong by historical standards, supporting a positive overall outlook for 2026.
The previous edition of this series can be read here, and the next quarter's edition can be found here.
Eric Wunder is a principal and consulting actuary, and Sarah Rice is an associate actuary, at Milliman Inc., an independent actuarial and consulting firm.
This article first appeared in the July 2026 issue of Medical Liability Monitor: http://www.medicalliabilitymonitor.com/.